Roads and highways
The traffic falls away, the road comes out as geometry
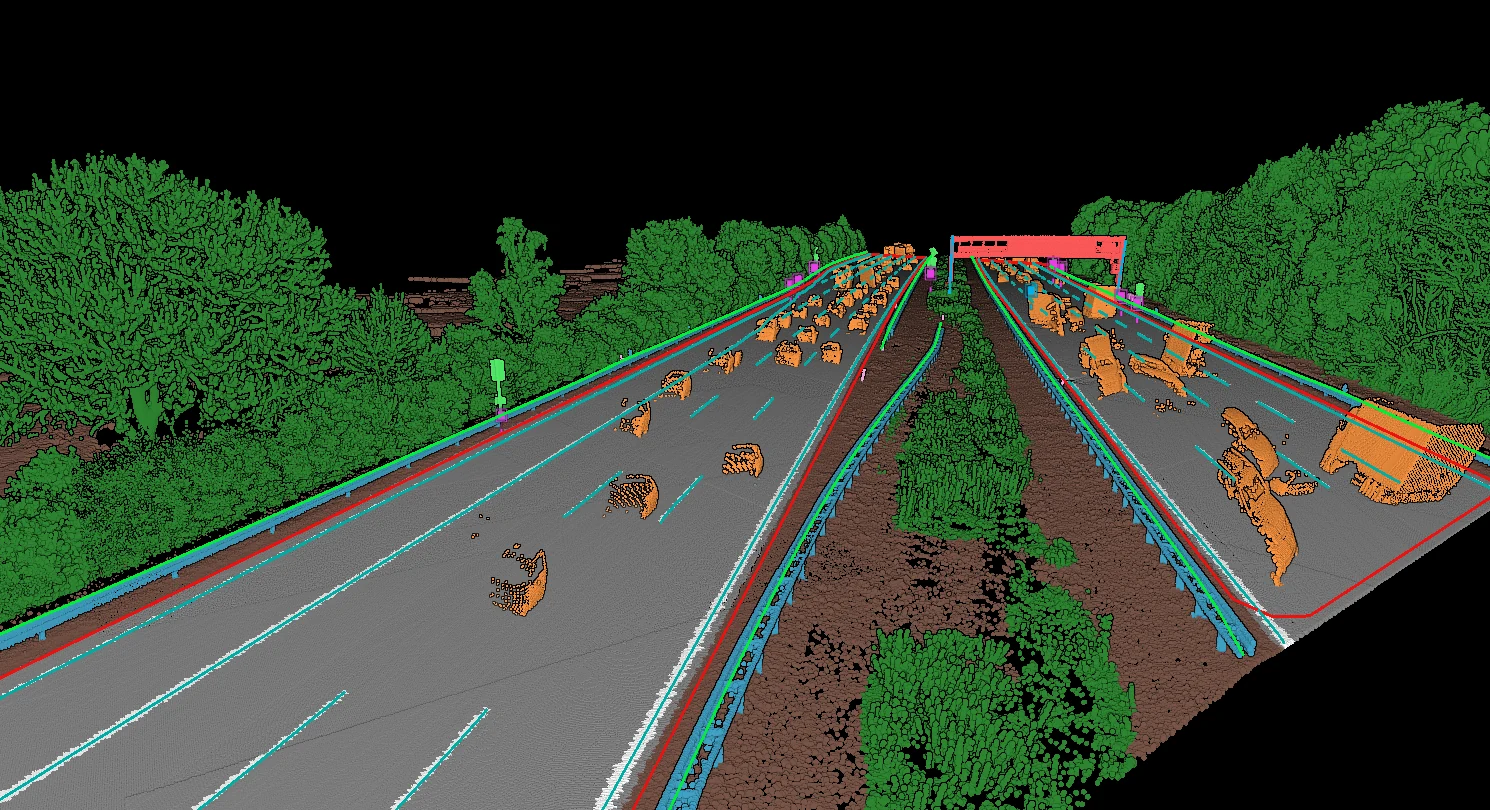
We take the traffic out and hand the road back as geometry: carriageway and verge as lines, and a row per sign, barrier and gantry in the format your asset system takes.
What we do to it
The traffic out, the road as lines and rows
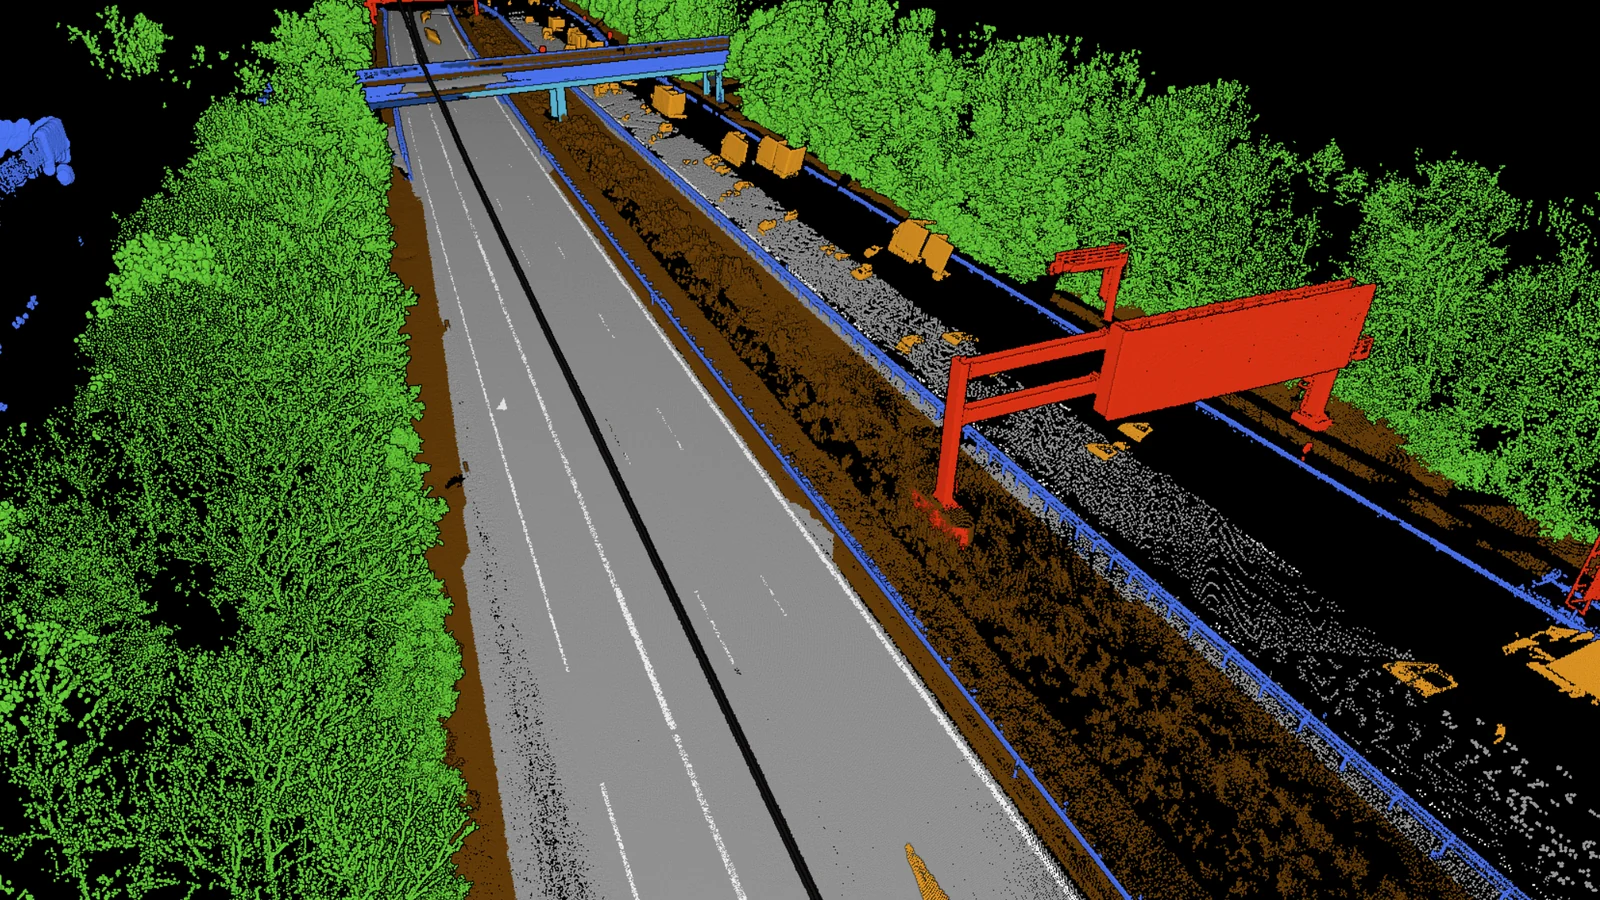
Where geometry alone is ambiguous, rule based steps and external reference data resolve it, for instance a road raster that separates the carriageway from everything beside it. Signs, barriers and markings are standard classes and stand in the catalog below. Mast attachments are added per project, on a base that already carries the corridor.
Carriageway, verge, structures and furniture, point by point.
Each object as geometry, with the position the asset system wants.
A row per sign, barrier or gantry, joined to what you already hold.
On real data
The traffic comes out
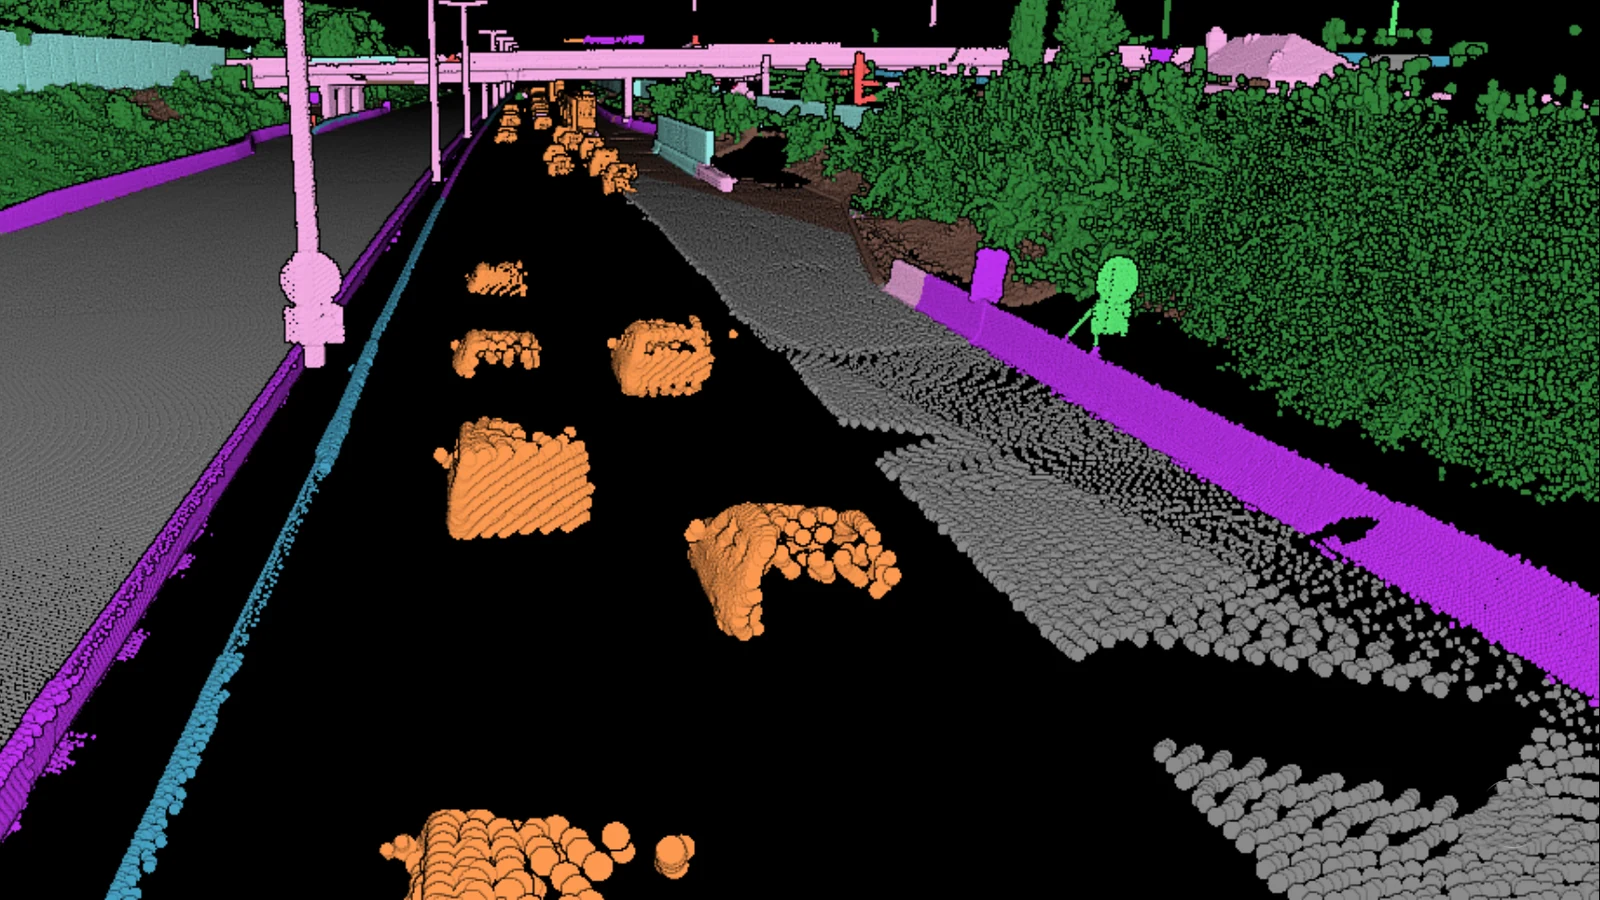
Passing vehicles, spray and the people at the roadworks are all in the cloud, and they are classified as what they are so they can be taken out. What is left is the road itself.
The road edge becomes a line
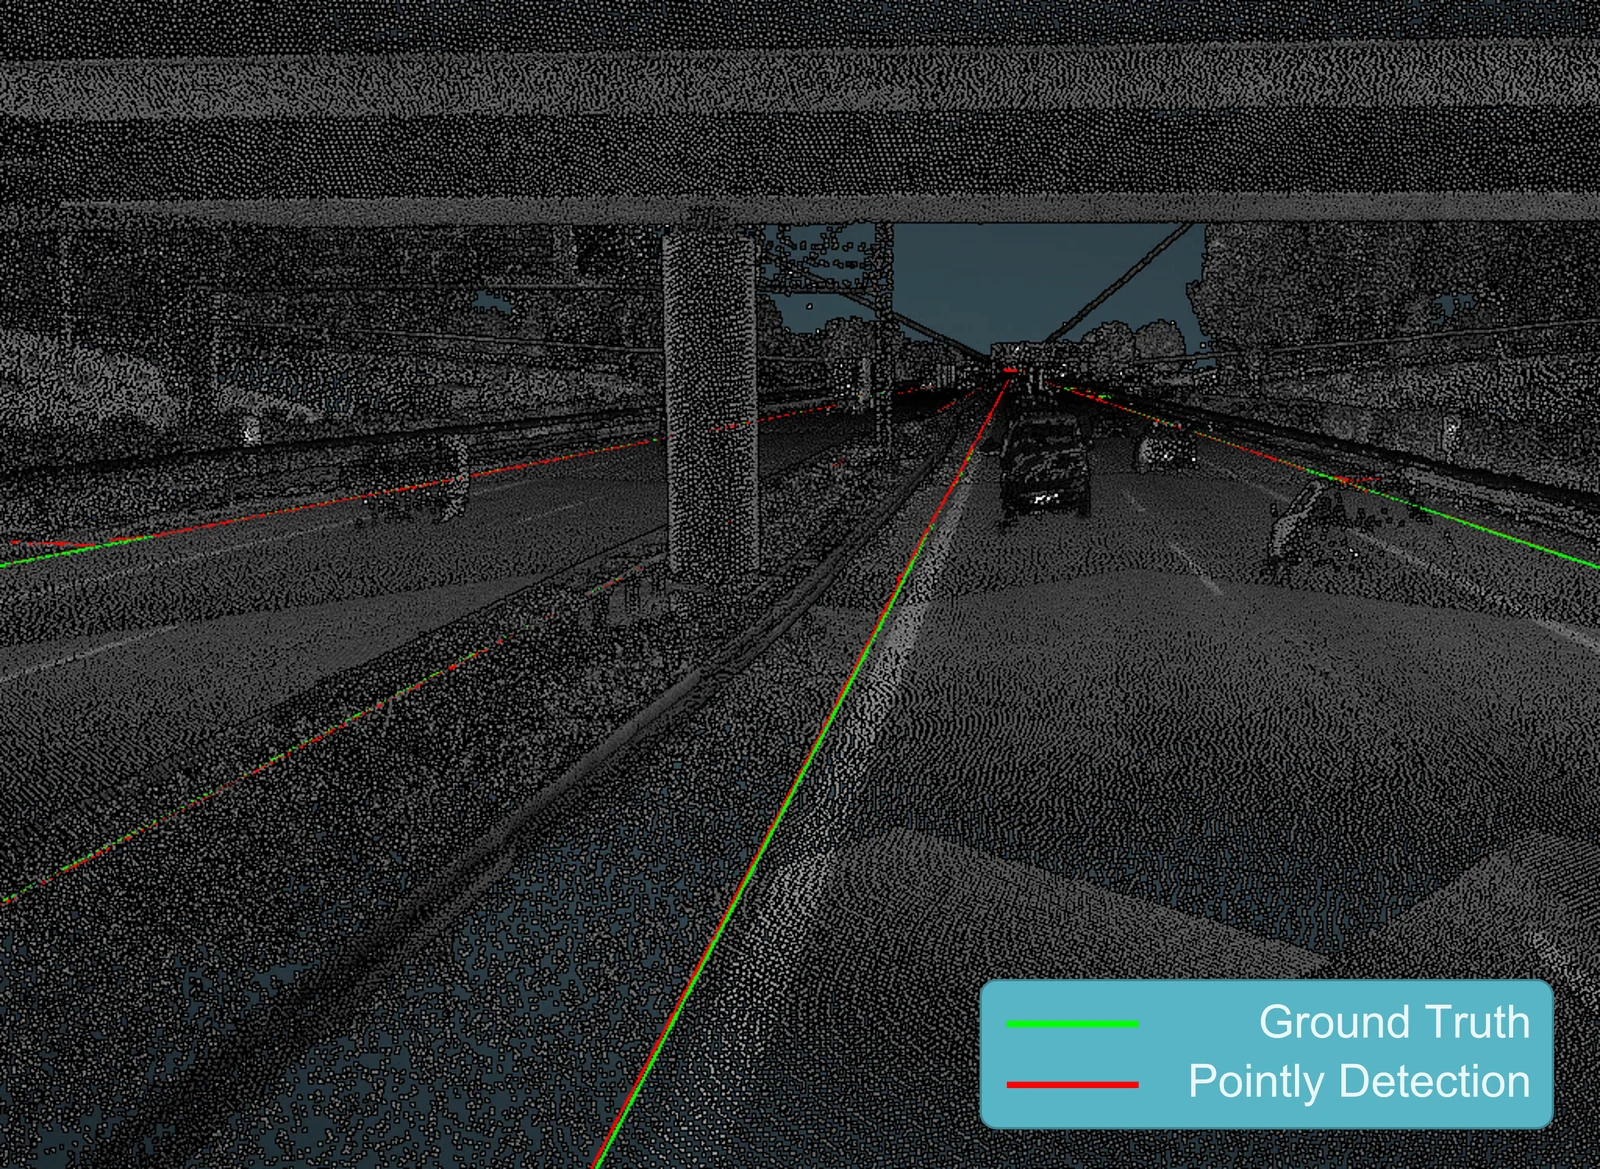
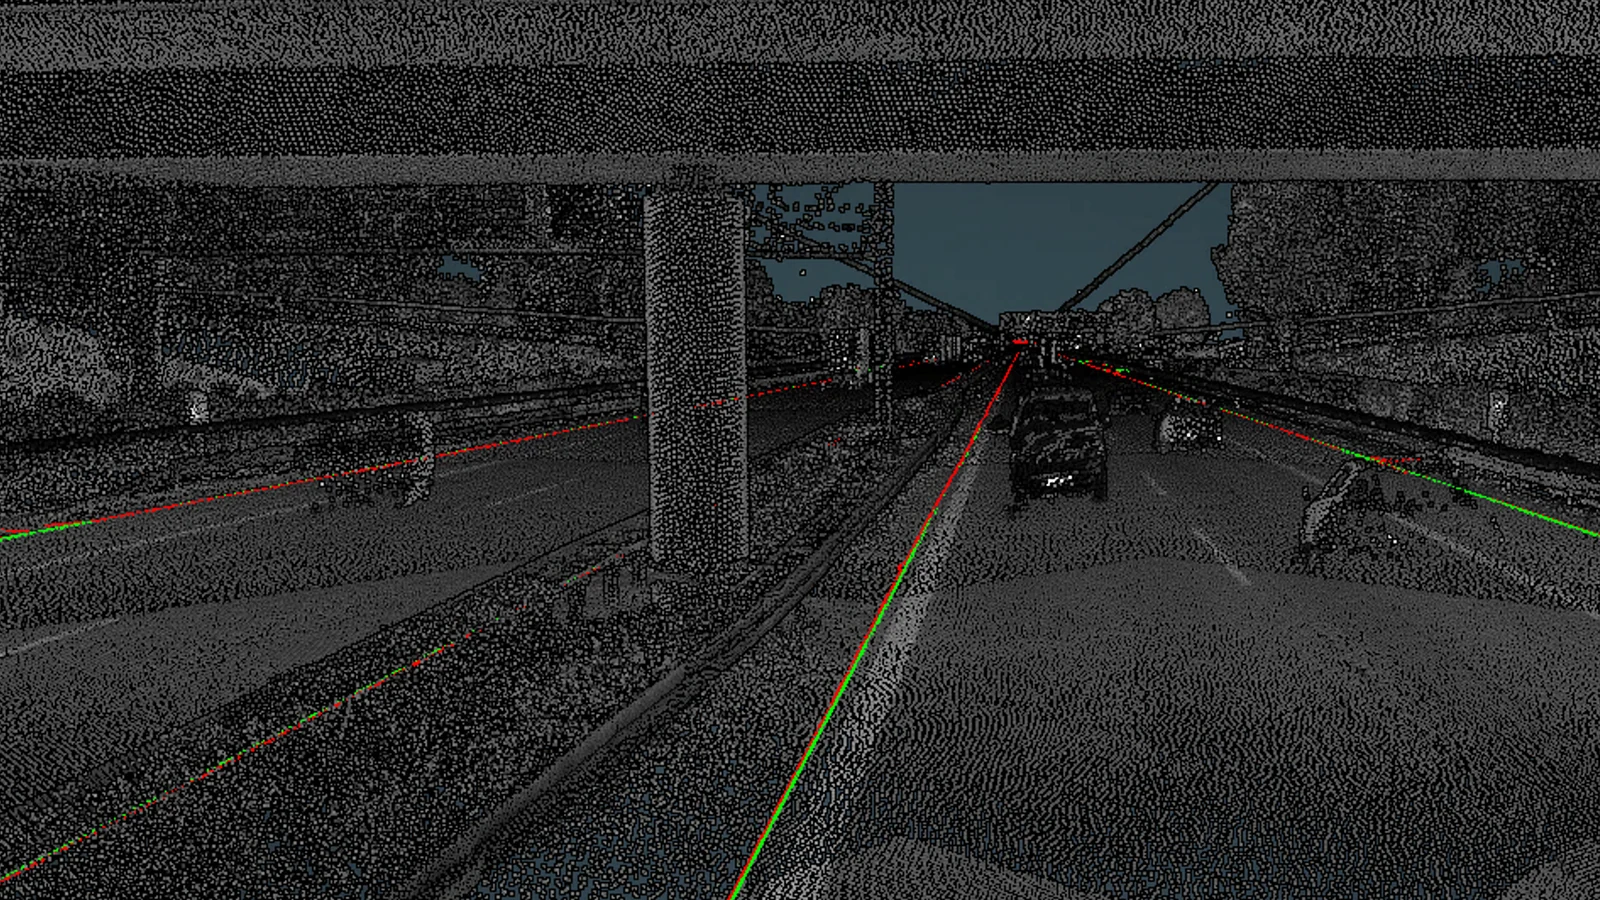
Asphalt and soil sit at the same height, which makes the boundary between them the hardest line in a road cloud and the one a CAD model starts from. On Bavarian motorways, 90 % of the detected road outlines were within 7 cm of the hand drawn ground truth. Read the Bavarian motorway project.
Everything over the carriageway
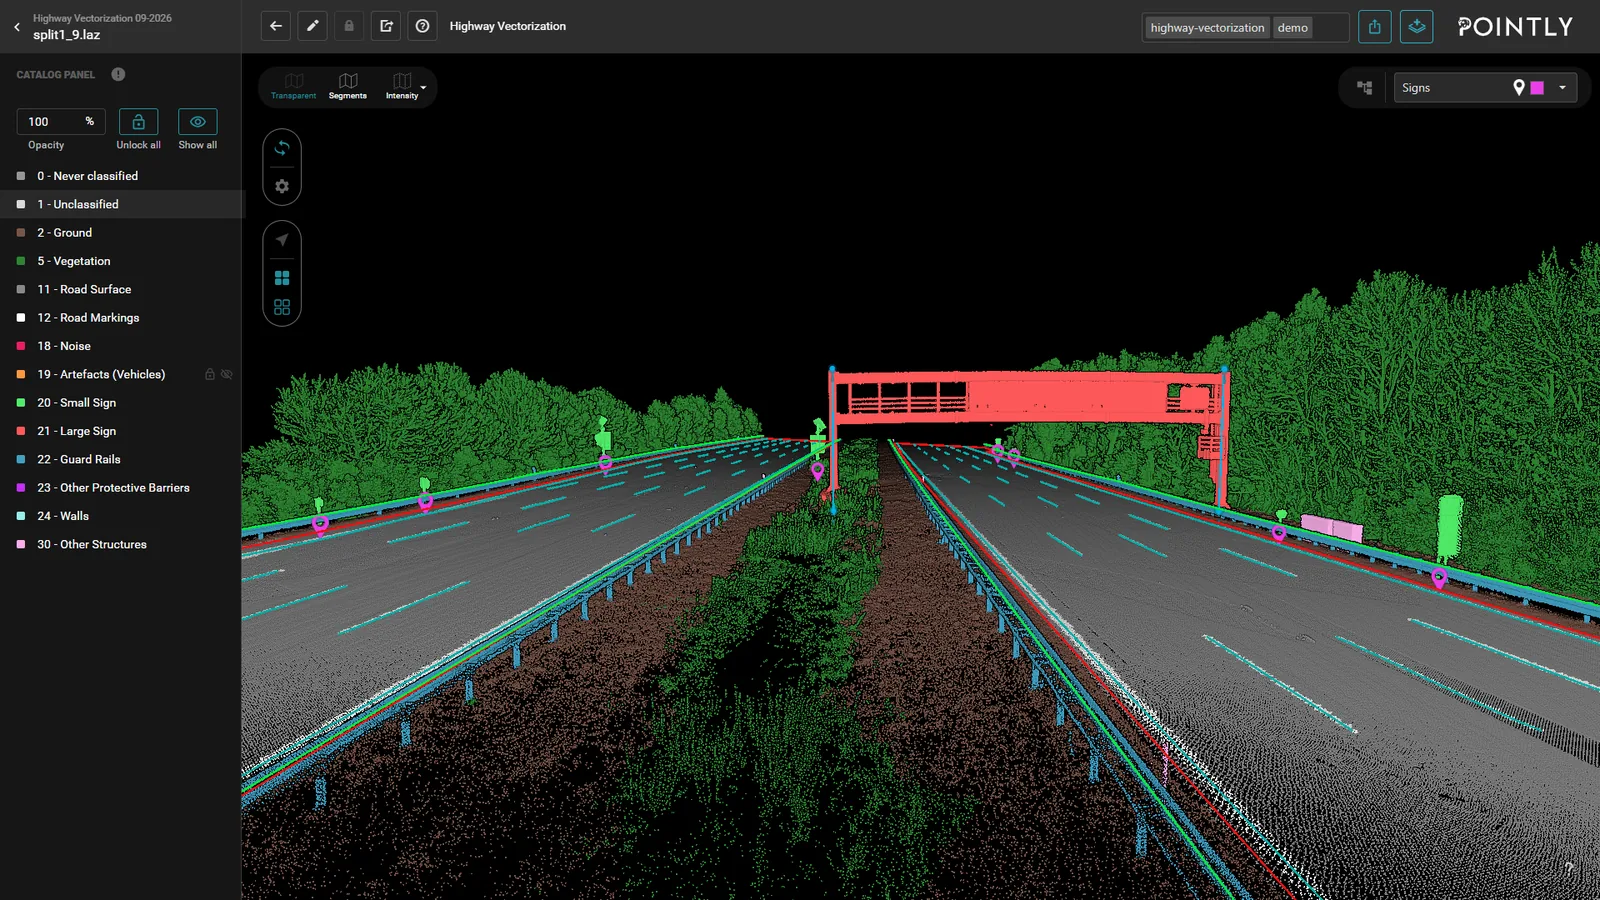
Gantries, bridges and sign portals come back as their own classes, which is what a headroom table is built from.
Deliverables
What the survey is for
Every point in your cloud carries a class. Every filter, cleaning step and derived product is built on it.
Headroom under every bridge, gantry and sign portal on the route, as a table. That table is what an abnormal load application gets decided on.
The vegetation and the structures that intrude on the envelope over the carriageway, section by section, so the cutting list comes out of the survey itself.
A surface model of the carriageway with its cross slope, and the low points where water will stand.
Painted markings as geometry, with the lengths and areas a renewal quantity gets priced from.
Run lengths per barrier type with positions, joined to what the asset system already holds.
Passing vehicles, people and scan artefacts taken out, so the inventory shows the road itself.
What lands in your hands
The output
- Survey vehicle
- Drone
- Airplane
- Tripod
mobile mapping, airborne and terrestrial lidar
- LAS
- LAZ
- DXF
- Shapefile
- CSV
- GeoJSON
classified cloud and objects
Pre-trained Standard Classifier
Our pre-trained Standard Classifier for mobile laser scans of highways, available right away. Test it on your own data at any time with a free account. It was optimized for point clouds with high point densities and intensity values.
12 classes
recommended
- Intensity
required in the file
| ID | Class |
|---|---|
| 2 | Ground |
| 5 | Vegetation |
| 11 | Road Surface |
| 12 | Road Markings |
| 18 | Noise |
| 19 | Artefacts (Vehicles) |
| 20 | Small Sign |
| 21 | Large Sign |
| 22 | Guard Rails |
| 23 | Other Protective Barriers |
| 24 | Walls |
| 30 | Other Structures |
This is the starting point for your project. We adapt it to your specification, usually within a day.
Adapted to your project
Custom model training and finetuning for your dataset
We train on your data and tune the model to the specification you work to. Classes get added, split or cut.
A project like yours
What Esri's president said

“they've developed AI based Machine Learning tools to predict where road maintenance should go on. It's just amazing work.”
See it on your own data
Send us a sample with your project requirements, or open a free account and test our Standard Classifier yourself.
Related reading
From the blog
Introducing Pointly's Point Cloud Classifier for Highways
A standard classifier for mobile mapping scans of a motorway: the carriageway, the signs, the barriers and the passing traffic each separated, on data captured at highway speed.
Pointly wins the Geospatial World Excellence Award 2021
Excellence in Transport Infrastructure, for the automatic generation of CAD models from highway scans. Ninety per cent of the detected road outlines were within seven centimeters of the manually drawn ground truth.