Automatic Powerline Analysis with Pointly
2 min readUtilities, Knowledge
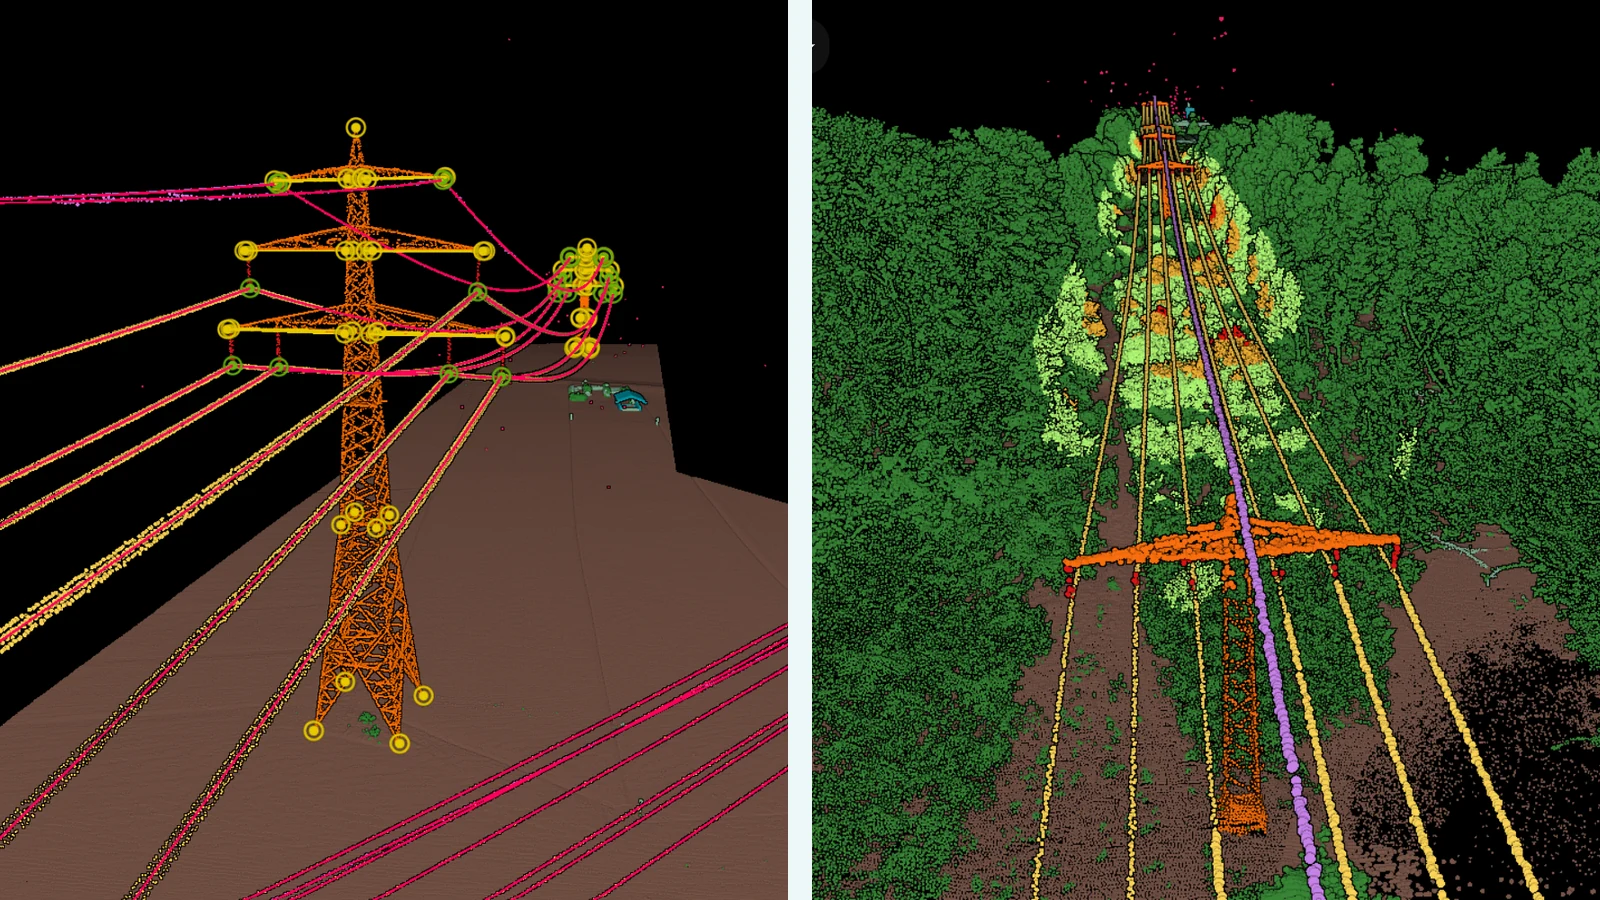
Powerline corridors are increasingly captured using airborne LiDAR data. Data acquisition has become highly automated through the use of UAVs and improved sensor technology. While capturing the data is becoming easier and faster, the analysis of these large datasets still requires many hours of manual work.
This process can now be automated using Pointly's AI based workflows, allowing teams to extract valuable information from point clouds quickly and reliably.
Overview, Pointly's automatic workflow
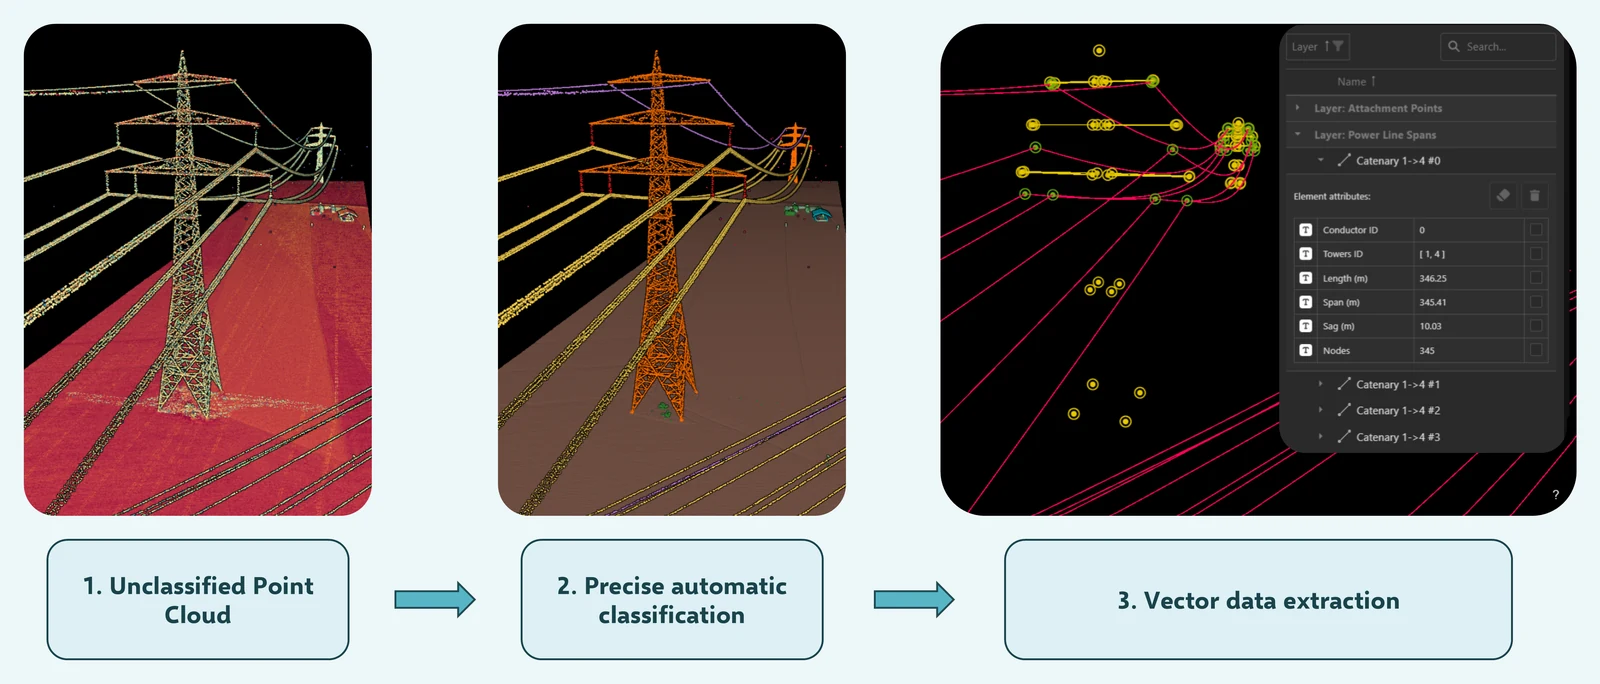
At the core of the workflow is precise automatic classification of the point cloud.
Pointly trains AI based classification models according to the specific requirements of each customer. These models automatically identify relevant elements such as powerlines, transmission towers, insulators, ground, vegetation and surrounding infrastructure.
Step 1: AI-based workflow for automatic classification
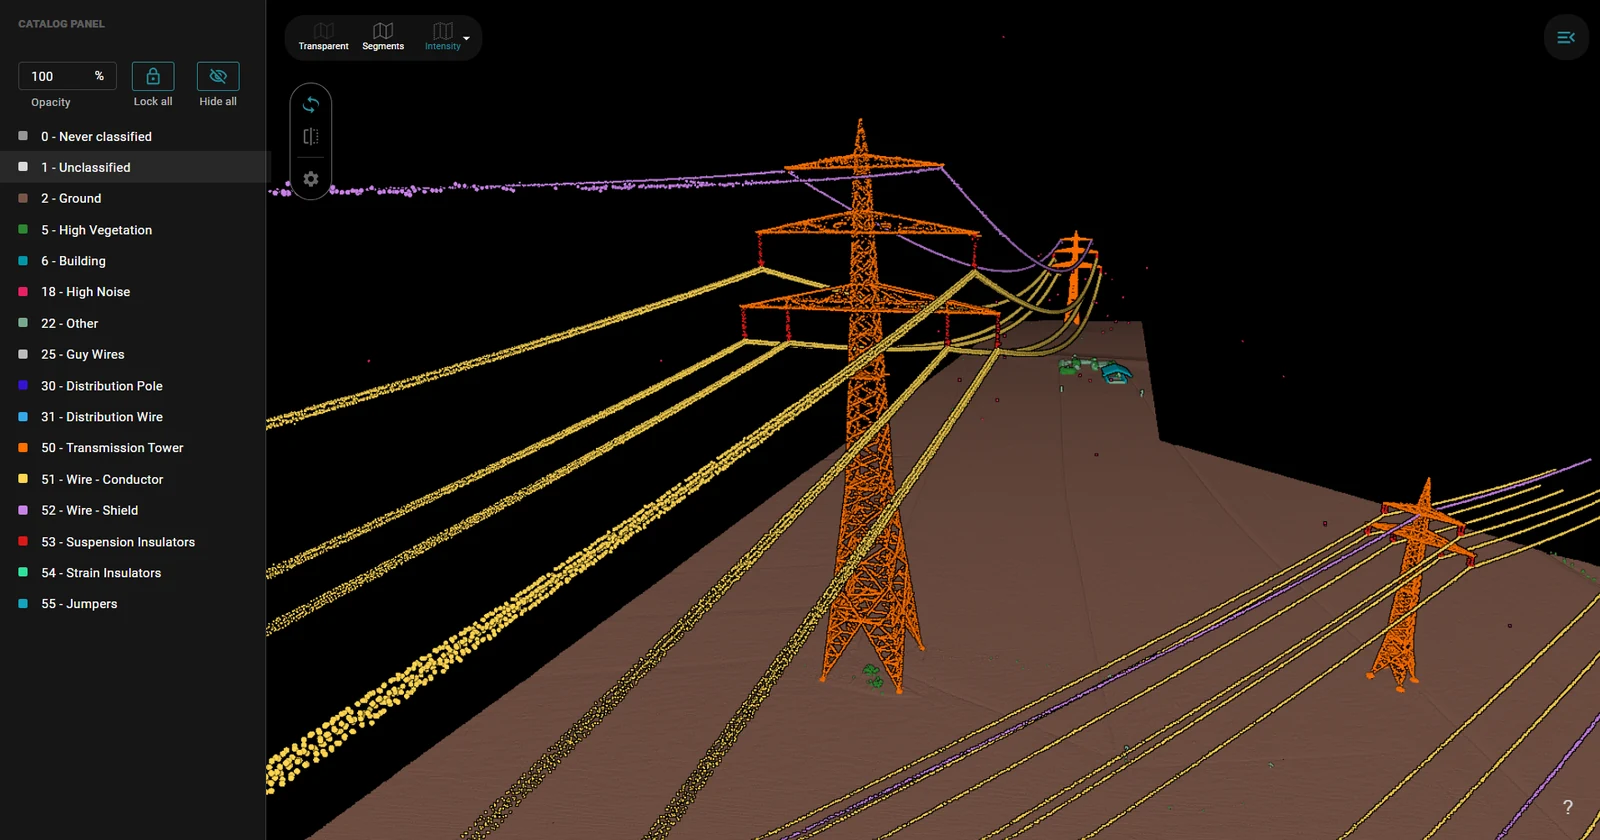
This structured classification enables the next step, precise automatic vectorization.
We use the classified data as input to perform automatic vector data extraction.
Powerlines are converted into clean vector files that can be directly used in GIS workflows or asset management systems.
Step 2: Automatic vectorization
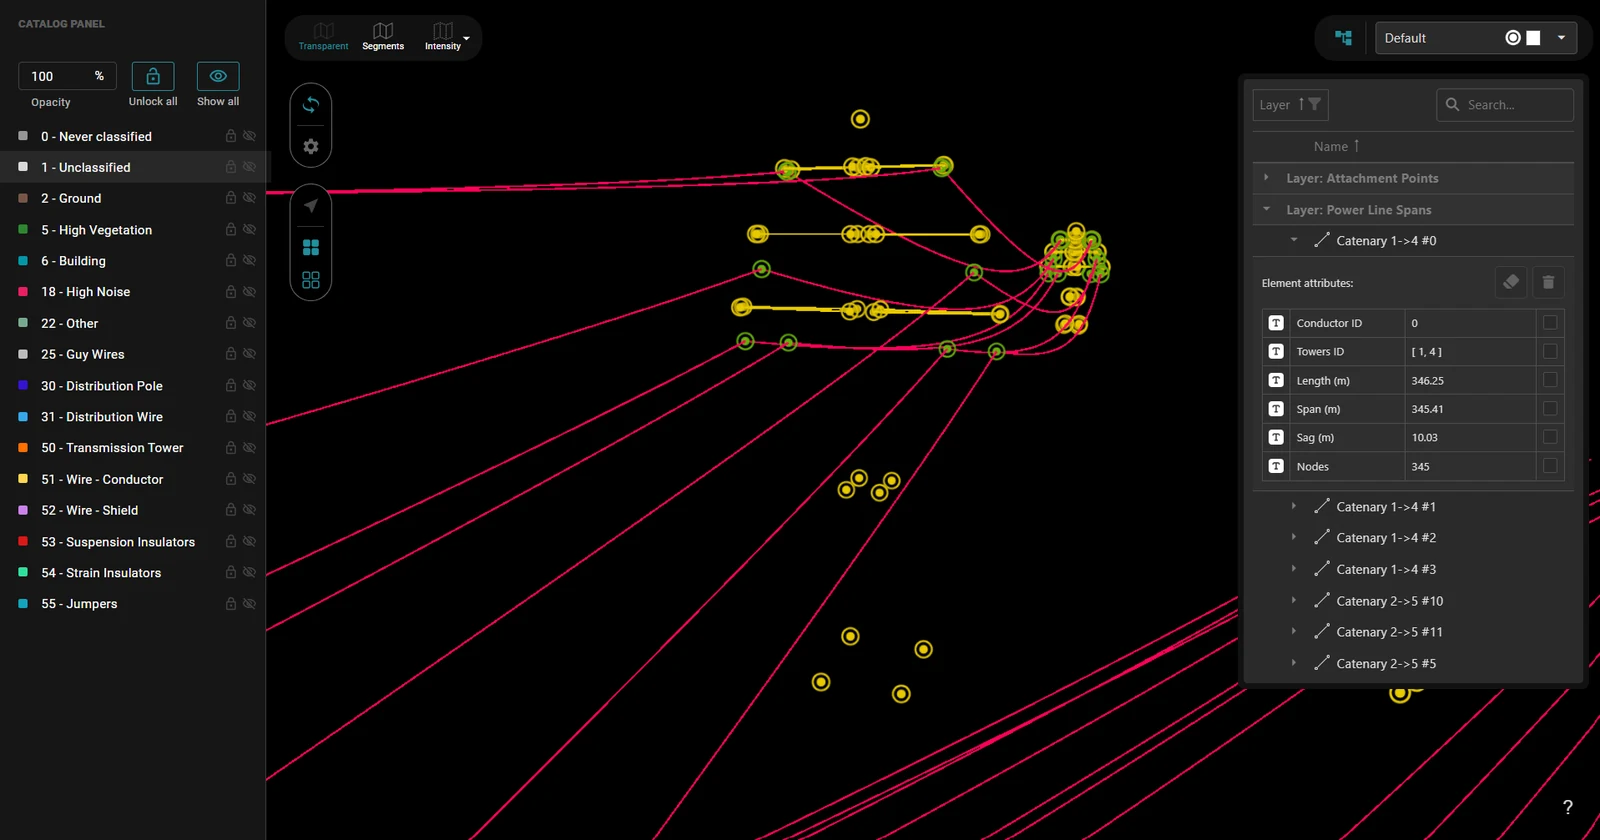
The vector output can be fully customized and typically includes exact tower positions and heights as well as the 3D coordinates of insulator connection points and a basic BIM representation of the infrastructure.
On top of classification and vectorization, Pointly can extract additional insights from the data.
This includes automated encroachment detection, which identifies vegetation or other objects approaching safety distances, as well as instance segmentation or change detection that highlights differences between repeated surveys.
Step 3: Example, encroachment detection
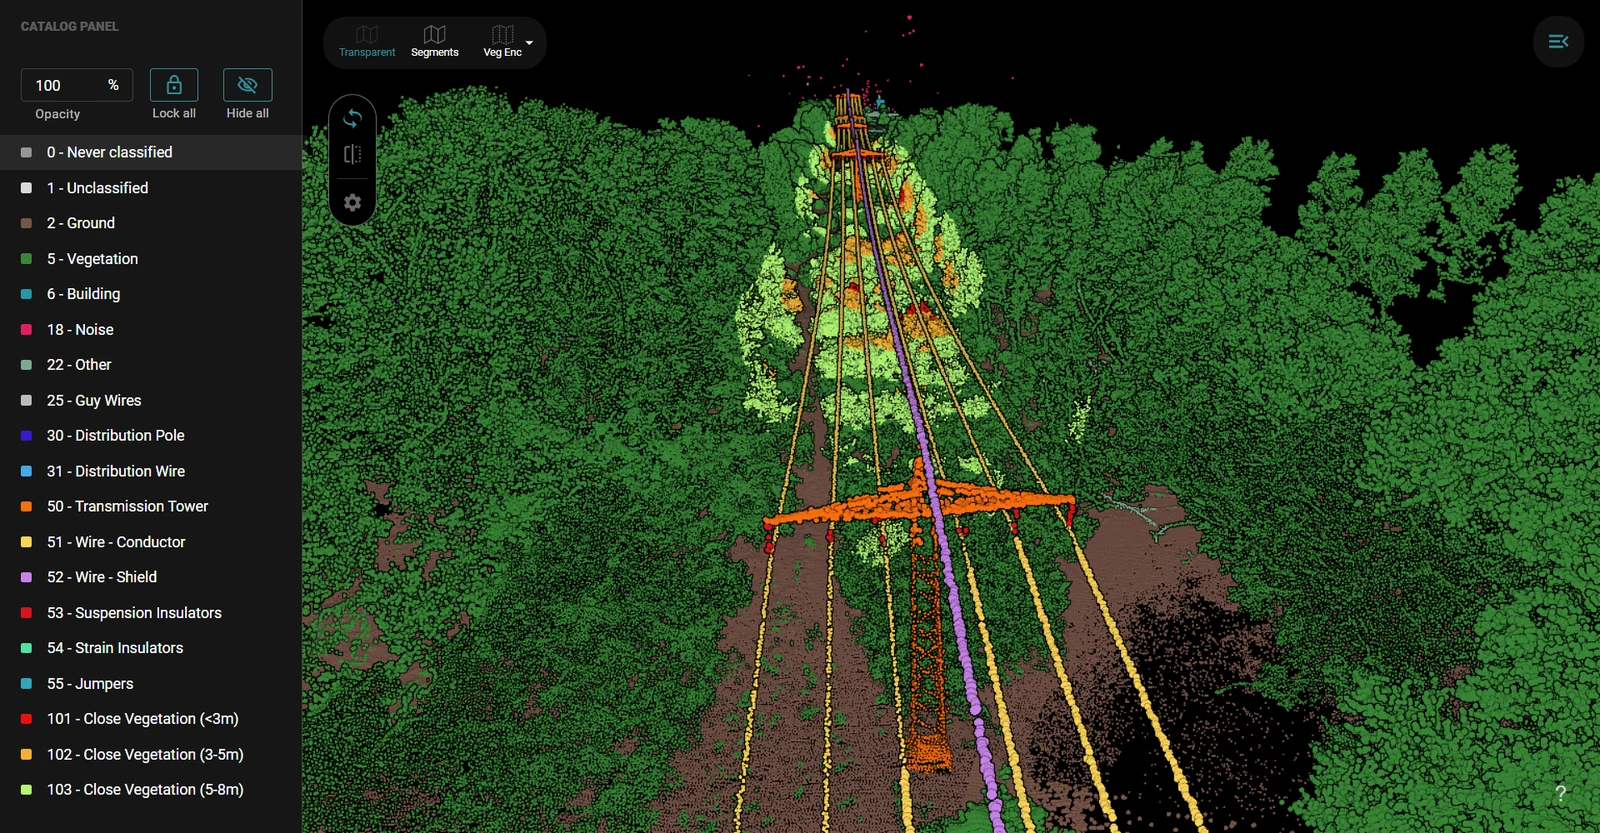
Vegetation inside the threshold distance to the wire comes back as its own classes, banded by how close it is.
- Close Vegetation under 3 m, red.
- Close Vegetation 3 to 5 m, orange.
- Close Vegetation 5 to 8 m, light green.
The areas can be exported in several formats depending on the intended use. Standard outputs include vector and shape files for GIS integration. For assessment and documentation, a structured PDF report about the identified areas can also be generated automatically.
With this workflow Pointly transforms large scale point cloud data into actionable information for powerline monitoring, inspection and maintenance.
Read more about Utilities.
Read next